.
.
.
by Debbie Cook; cross-posted from Surf City Voice.
On a clear day…
Give me a chimpanzee with a dart board and I’ll give you a water demand forecast about as reliable as we’re getting from Orange County’s water leaders.
Who cares about a forecast you say? It’s just garbage in, garbage out?
Well, we’re all gonna care when we discover that taking out the garbage just cost us a billion dollars for an ocean desalination project!
In business, you risk your own money when you make a bad forecast. In the public arena, on the other hand, the public pays the cost of bad forecasting in expensive and unnecessary projects.
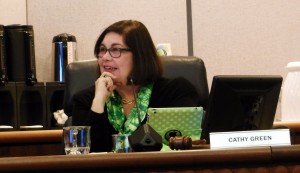
In Orange County, hardly a meeting of a water agency goes by without a board member championing the need for ever-increasing water supplies. On two recent occasions I have heard OC Water District Board President Cathy Green project that “we” needed another 80 to 90 thousand acre feet of water by 2035 due to projected population increases.
Many if not most public agencies rely heavily on population growth as a driver of future water demand forecasts. It seems logical at first blush: more people, more demand. But the reality is more nuanced, and population and consumption are becoming poorly correlated due to many factors.
The Seattle Public Utilities is a case on point. Prior to investing heavily in massive infrastructure, they decided to re-visit their demand projection forecasts, which were constantly revised downward, as shown in this chart (click for larger view)…

For example, they discovered that in 1985 the City of Seattle projected that demand by 2000 would be 200 million gallons per day (mg/d) and by 2005 would be 210 to 215 mg/d. The actual 1987 demand turned out to be 147mg/d and in 1992 it was 130 mg/d.
In the Seattle region, the reevaluation of demand forecasting ushered in the adoption of new forecasting models that serve the unique characteristics of each community. Population is still a consideration but it is now modified by mitigating factors. These changes have resulted in the determination that water demands could be met through 2050 without additional and costly infrastructure projects.

Indeed, nationwide, urban water consumption is responding to practices that are driving down per capita consumption, including the price of water, frequency of billing, changing demographics, housing types, the extent of adoption of efficient technologies, conservation, and the effect of education and public attitude.
Has Orange County bucked this national trend? Well, let’s see.
OCWD manages the Orange County groundwater basin and serves those cities that hold rights to pump from the basin. This year, the basin is providing 72 percent of North Orange County’s water needs.
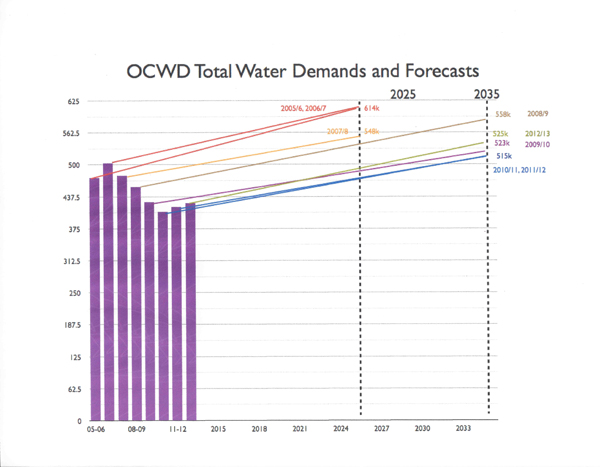
From the OCWD website I was able to download Engineer’s Reports from the past eight years. From these and other public documents you can see that OCWD members are making the same forecasting errors that were being made in the Seattle region.
In 2005/06 OCWD forecast demand would jump from the then current demand of 500,000 acre-feet to 614,000 acre feet by 2025. By 2012/13 they had modified projections from the then current demand of 435,000 acre feet to 525,000 acre feet by 2035. In an eight-year span the demand forecast had been reduced by 89,000 acre feet without any analysis or comment.
But what is the trend in the OCWD service area? In other public documents I found historic data going back to 1989. If you run a linear trend line forward you see that consumption is trending downward, not upward.

There is no debate that population has increased in Orange County. However, reading OCWD’s reports shows that perhaps we need to bring back the chimp for another round. Here are the reported then-current populations and projected populations listed in the reports:
- 2005/06 2.3 million, grows to 2.55 by 2025
- 2006/07 2.3 million, grows to 2.55 by 2025
- 2007/08 2.4 million, grows to 2.67 by 2025
- 2008/09 2.38 million grows to 2.7 by 2035
- 2009/10 2.38 million, grows to 2.7 by 2035
- 2010/11 2.28 million (census year), grows to 2.54 in 2035
- 2011/12 2.28 million, grows to 2.7 in 2035
- 2012/13 2.28 million, grows to 2.7 in 2035
The reality check was the 2010 census, but future and past population numbers appear to be plucked from thin air, lacking any kind of objectivity or scientific rigor. I think it is fair to say that these figures are random at best.
Orange County has NOT bucked the nationwide trend of declining per capita consumption. But like many water agencies, OCWD ignores the data or uses it to promote a self-serving agenda.
What we focus on determines what we get. Unions and consultants want to build massive infrastructure projects and favor forecasts that show growth in demand. Ecologists want multi-benefit solutions that reduce environmental harms. Rate payers want abundant water and stable rates but are caught in the middle, confused by bad forecasts and misinformation.
Accurate forecasting allows agencies to meet water needs in an efficient manner and at the minimum cost. But if our forecasting is consistently bad, if we never submit our data to a reality check, then we can easily forecast a future of costly and unfortunate water decisions.

– See more at: http://www.surfcityvoice.org/2015/03/oc-water-district-tomorrows-forecast-is-cloudy-with-a-chance-of-error-2/
Developers can’t develop without water on paper…..Gus told me that.
Yep. It all comes back to putting more houses on hills — and cars on highways.
The reason the OCWD keeps projecting overstated need is to keeps itself occupied and to protect the mountain of cash it sits on – raked off our property tax bills. That’s the carcass Poseidon wants to get its hooks into before other jackals show up. As noted, per capita usage is trending down and may get to a point where the absolute amount of usage drops, too.
Don’t just blame the “developers” as manupulators; take a hard look at the rogues gallery that constitutes this board. They need the developers, and even the promise of developers. That’s the way all of our water agencies work. They started out as contrived government facilitators of the big land owning developments; then they took on a bureaucratic life of their own. Now there is a nice symbiosis. Consider the Santa Margarita Water District – a wholly owned subsidiary of Rancho Mission Viejo.
I put the above comment up on our Facebook page “OCWD: Orange County Water Dissidents.” You may not do Facebook Dave, but you are now a Facebook star.
https://www.facebook.com/1376007909373429/photos/a.1376285719345648.1073741828.1376007909373429/1376769829297237/?type=1&theater
Oh, joy!
Poseidon water exceeds the cost of MWD water. Will Poseidon water meet the water quality standards of the water districts. Why should the OCWD finance Poseidon when they OCWD can build the plant themselves cheaper and more cost effective. Built the world famous GWRS plant without any Poseidon interference let alone having to pay for over priced water..
Many of us have had great concern regarding Director Dewane’s conflicting interests and positions. How DOES one sit on the Board of the water retailer (OCWD) that votes to set the rates, while also being on the Board of the consumer (Mesa Water) that votes to buy this water and then votes to raise the rates to the end user…….us?Being a Poseidon shill is a third layer of conflict. He needs to recuse himself from ANY vote where Poseidon is concerned.
Third layer of conflict. That’s how he gets that Jersey Shore look.
“In business, you risk your own money when you make a bad forecast. In the public arena, on the other hand, the public pays the cost of bad forecasting in expensive and unnecessary projects.”
In business, if you’re any good at it, you risk OTHER PEOPLE’S money first, guarantee your own capital through numerous risk shifting measures, and tweak a plan in response to whatever occurs. In the public arena, you risk your own community.
By the way, to the extent Zenger/Cantor have a good point about the residency fetish, it’s this: a leader who does not actually lead their own community puts other people’s communities at risk – rendering them just as susceptible to business insiderism as any private sector leader (though in business, survivor bias means that mistakes get forgotten/forgiven quickly – while in public sector, folks still gotta live somewhere).
I don’t have a residency fetish.
It’s about telling the truth. Don’t misstate the objection.
Alright then, Ryan, you have an ‘honesty over residency’ fetish. I hope you’ll demand the same sort of honesty in other contexts as well, but this is the only one I’ve seen you get irate about.
Alright, now you just need a dictionary.
I don’t have a residency fetish.
I don’t have an honesty over residency fetish.
I’m also not irate about any of this.
I recently made the claim that you constantly talk past me. This is exactly what I mean. Making crap up and substituting it for what I actually believe is not a part of healthy discussion.
Knock it off.