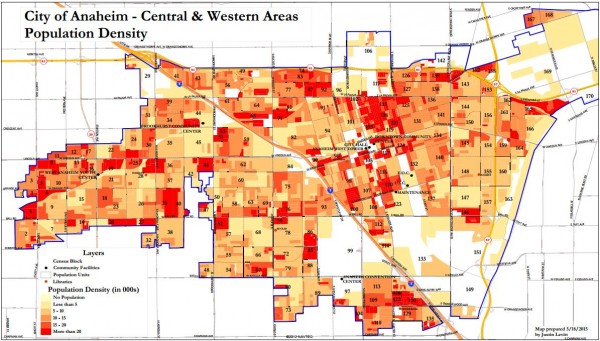
A map-maker has to bear not only geography in mind, but also population density. Here, courtesy of the city, is the density of various areas within Anaheim’s flatlands. Red=most dense, ivory=least dense though populated; white=no population.
1. A Sort of Historic Day for Anaheim
Anaheim’s creation of its first-ever voting districts will shift into a higher gear tonight at 6:30 in the City Council chambers as about a dozen maps considered by the public will be unveiled. (Technically, they’re already available online, but this appearance before the advisory panel of judges will be their formal introduction to the public.)
While it may not seem like it — next to yesterday’s interviews of candidates to become the City’s first permanent City Manager in over a year (more on that later), or the first July 4 with a somewhat bizarre centralized fireworks sales plan (more on that later too), or the big visit from the Dalai Lama on July 5 (and even more on that later) — this is sort of a big day in Anaheim’s history. Anaheim is moving to a new form of government — various parts of the city will come to be represented on the City Council that have barely ever had representation — and these maps may have influence not only through the end of this decade but for decades beyond.
Here’s a preview of what you’ll see — which, when your humble author has more free time available, will lead to much more discussion.
(Disclosure of interest: I teamed up with Brian Chuchua to produce one of the maps that will be under consideration. I think that it’s a good map and will eventually explain why, but it’s not the only good map out there — although some of them really aren’t very good and I’ll try to explain why. One feature of Brian and my collaboration is that, fittingly for the Orange Juice readership, it was bipartisan — Brian’s a Republican and I’m a Democrat, and we both agreed that partisanship should play no role in the results so I haven’t even looked at the partisan numbers. For all I know, our map could make our political adversaries celebrate and our friends cringe. In our view, it’s not about gaining some sort of sneaky advantage, but about coming up with a map that the public will view and agree looks fair and — literally — balanced.)
2. The Process From Here
What you’ll see tonight (if you show up or watch the video later) is several steps removed from the final decision over what maps to adopt. These public submissions are, in effect, advisory to the city’s hired demographer, Justin Levitt of San Diego, who has been helping members of the public with their maps. (I can attest that, as I was creating our map in the middle of a major computer breakdown that has led to, among other things, much less publishing here over the past few weeks, he was very helpful in catching errors that were hard for me to see while working largely blind.)
Levitt will take the maps provided from the public, the communications received by the city, the feedback from the panel of judges, and his own sense of what works best to create one or more proposed and recommended maps of his own. The judges will consider them, listen to more public comment and other feedback, and come up with their own recommendation (which presumably could include “dissenting opinions”) for the City Council. The City Council will then come up with its final choice of map — which could be that proposed by Levitt, by the judges on the advisory panel, by someone from the public, some combination of them, or could be their own concoction.
We usually say that the City Council has the final say on the maps. That’s likely, but not necessarily true. The maps could be challenged in court based on federal law, state law, and/or other considerations. One benefit of the process taking place now is that the more maps that do things a certain way make it that much harder for the Council to engage in some really nasty gerrymandering to their own personal political benefit — as used to happen in California routinely before our Citizens Districting Commission (which was upheld by the Supreme Court on Monday, by the way!) and still does happen by self-interested bodies such as our Board of Supervisors. So while in one sense this early part of the process may seem pretty meaningless, it does provide a check on the City Council if it later decided to do something very self-interested or bizarre.
3. The Submitters
Eleven maps submitted by the public have been entirely vetted by the demographer, Mr. Levitt — although in at least one case his suggestions seem likely to have been rejected — and may be viewed in a consistent format. Three other maps, one by Oscar Reyes and two by James Duron — haven’t gone through that process and neither had “whole city” versions of the map available. Mr. Reyes does offer individual maps of individual districts, which could be used to piece together a complete map, but he didn’t provide one and given that my Photoshop program is ailing right now I am not taking the time to put one together. You can see Reyes’s maps here and Duron’s maps here and here. If anyone else can join together the puzzle pieces of Reyes’s map, I would be very happy to include it below.
So here, in alphabetical order, are the eleven submitted maps that (with one slight exception) have been fully processed:
- Ronald Bengochea [link to “web view”]
- Brian Chuchua [link to “web view”]
- Michael Dresser [link to “web view”]
- Claudio Gallegos [link to “web view”]
- Grant Henninger [link to “web view”]
- Grace Kim [link to “web view”]
- Francisco Lugo [problem with web view link, so here’s the raw revised proposal]
- LULAC 1 (Santa Ana LULAC’s Art Montez and Zeke Hernandez) [link to “web view”]
- LULAC 2 (same submitters as above, but second option) [link to “web view”]
- Jason Mills [link to “web view”]
- Jordan Warner [link to “web view”]
If I know anything about Lugo and Warner, it’s escaping me at the moment. Here’s a bit about the others:
- Bengochea is a frequent commenter, generally sympathetic to the Resort District, at Council meetings
- Chuchua is Treasurer of CATER, Vice President of Anaheim Small Business Association, and much more.
- Dresser is respected by a friend of mine and I believe lives near Anaheim Canyon. His map will speak for itself.
- Gallegos is one of the “go-to” mapmakers associated with the local Democratic Party
- Henninger has commented on Matt Cunningham’s blog, quite intelligently, about the districting process
- Kim was the Chair of the City’s Charter Review Commission and seems to be widely respected
- LULAC’s proposal comes from Centralia School Board member Art Montez and Zeke Hernandez, who is very active in OCVMP veterans issues and I believe is President of Santa Ana LULAC
- Mills is a Democratic political consultant and activist who has been associated with local politicians including Sharon Quirk-Silva and Tom Daly (and, interest declared, has sometimes worked with my daughter on races where she is a campaign Treasurer, though Mills and I are often at odds on other races such as Daly’s)
4. How to Read the Statistics for Each Map
Each map is accompanied by a page of statistics, which I have snagged and included below. Here’s an example of how to view them. Because I can’t show you Reyes’s full map, I will give him the benefit of using his (quite impressive) statistics to explain how this works. (Obviously, this is hard to read, but if I’ve done this correctly you can see a version that’s twice as big by clicking here.)
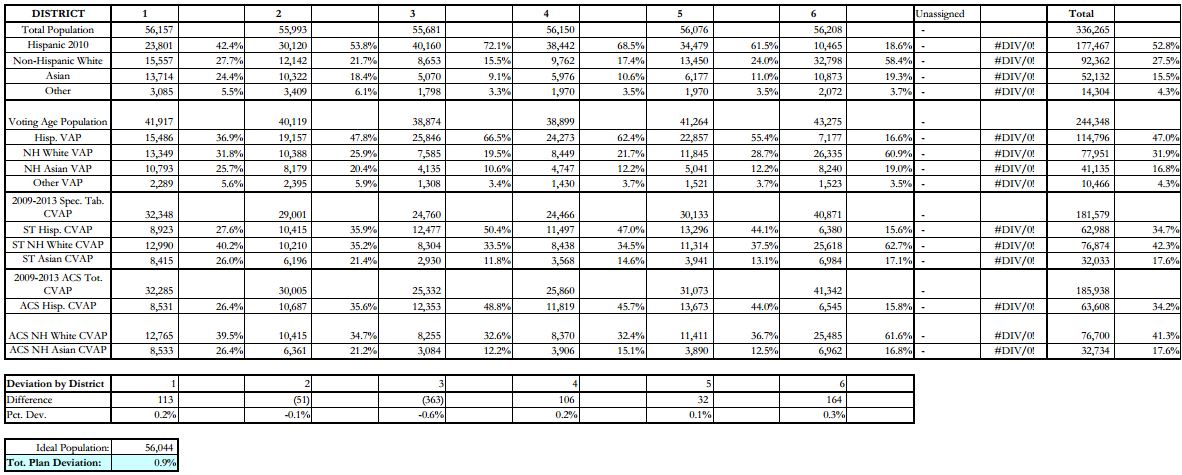
This is not what you’ll see for in the other; this is what we mapmakers saw when we were creating them. Not only does it omit lots of information about the age and other demographics of the voters within the district, but it lacks two pieces of information that I will include for each map: estimated voter registration by minority ethnicity (essentially, Latino, Asian, and Filipino, the last of which is variously considered neither and both.)
What you see above is assignments to six districts along with totals to the right. The first block of five rows under the title row provides these categories of information:
- the raw population figures for each proposed district — including minors, non-citizen legal residents, and others — broken down by race/ethnicity.
- the voting age population for each proposed district — essentially the above number minus minors
- the “ST” estimate of the citizens of voting age for each proposed district — essentially the previous block but limited to citizens
- the “ACS” estimate of the citizens of voting age, which is simply a different way to estimate the “Citizens of Voting Age Population” (or “CVAP”), which is the pool of potential voters
The stats you will see for the other maps will include only one estimate of CVAP (one or a combination of “ST” and “ACS”) as well as estimated voter registration by race/ethnicity and voter turnout by race/ethnicity. These were not available — at least not from the City’s furnished information — for people drawing the maps, though some (not including me) may have been able to obtain estimates otherwise.
The most important figures to look at are (1) the CVAP numbers and (2) the “deviation” numbers that tell you how much this plan deviates from absolutely equal representation across all districts. The number at the bottom highlighted in light blue is a “total deviation” number, which is a “quick-and-dirty” estimate based upon adding together the absolute values of the deviations of the district that has “too many” residents and the one that has “too few” residents. (I prefer to add up all of the absolute values of deviations across all six districts, but apparently that is either not how demographers generally do it or at least not how Levitt does it.)
With a total deviation of .9, Reyes’s map is the best of the bunch on that measure. The second-best is the Chuchua map; which includes instructions for how to “fine-tune” the deviations all the way down to zero if one wants. (As that likely involves dividing up city blocks, by suggestion is that the Council be satisfied with deviations of no more than 50 to 100 per district, which given districts of 56,008 residents apiece would still be pretty outstanding.)
5. The Maps and Their Stats
Here, so you can get a sense of them, is a repository of the maps. These will be discussed at greater length in a later post.
(a) Bengochea

Map-making can look quite simple. Sometimes it’s TOO simple.
Why NOT get two out of the six districts coming from Anaheim Hills? The answer involves “balance.”
I have to present two maps for Bengochea rather than one because he’s the only person who submitted a map that created two districts out of Anaheim Hills. (All but one of the other maps have identical districts.) Because Anaheim Hills up to Tustin Ave. or so pretty much has to be its own district — because if you start to the east and work westward Tustin Ave. is pretty much where your bucket of residents gets full — you can generally use just the first map of West and Central Anaheim for everyone because that’s the only place where they differ.
The problem with Bengochea’s map is that doing this would be illegal. Very, very illegal. Instant lawsuit level illegal. Look at the statistics and see if you can see why.

The goal is to get as small a deviation from equal numbers of residents assigned to each district as possible. Ideally, this would be under 1% or so — not this large.
Bengochea’s total deviation from perfect balance of 146.31% — which counts only his two most skewed districts, which have over 70% deviations, without even factoring in the roughly 27% to 30.5% deviations in the other four districts — blatantly violates the principle of “one person, one vote.” (Note: the Supreme Court has taken a case that might change this next year, but not by this much — and for now the current rule remains the law of the land.)
As you can see, the 14,506 voters in east Anaheim Hills would choose one representative and the 96,505 voters in southeast to central Anaheim would choose one representative. This would be the equivalent of giving one representative to the area around Anna Drive, one representative to the area north of La Palma between Euclid and Harbor, and then letting the rest of the city fight over the other four.
On the positive side, Bengochea’s division of most of the flatlands into four areas based on lines drawn at the intersection of Lincoln and Euclid is elegant. (I wish it were that easy!) This is the map that I presume that Mr. Levitt accepted only under protest.
(b) Chuchua
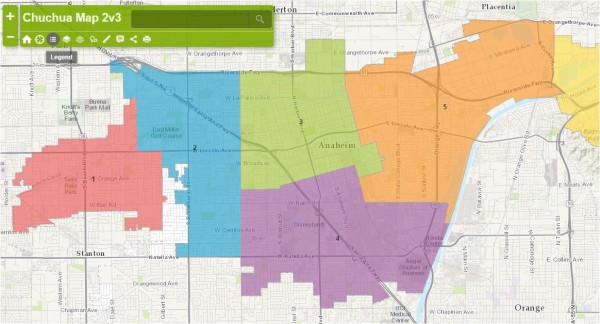
This is the map that is the product of Chuchua’s gread historical knowledge of Anaheim and its “communities of interest” and my desire to come up with a map that seemed obviously fair — the only deviations from near-perfect lines in the map are those required (1) by geography, (2) to keep (almost entirely) within the “census blog groups” (aka “population units”) that we were dealt, and (3) to maximize the population balance between districts. (We were able to get the “two extremes” discrepancy down to .99% — the total discrepancy will probably favor this map even more compared to the others — and we’ve figured out how to get it all the way down to zero if that’s what the Committee and the City Council want.)
Here are the statistics:
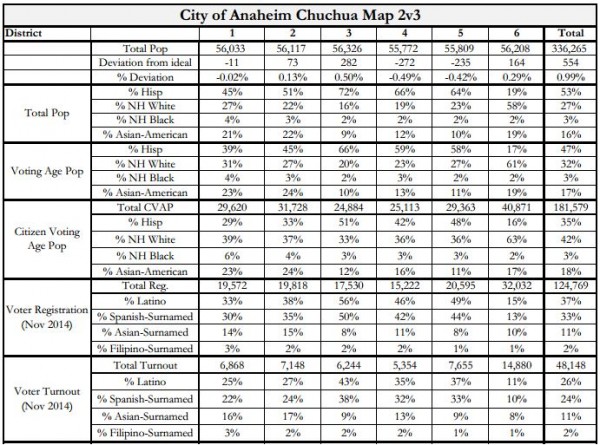
Some features to note:
- At the right, the difference between District 5 (orange) and District 6 (yellow) is mostly along Tustin Ave., leaving District 6 only 164 residents “heavy.” I believe that with a little fine-tuning it will be pretty easy to get this down pretty close to zero.
- Euclid Ave. divides the western third of the City from the eastern two-thirds. Combined, District 1 (red) and District 2 (blue) are only 62 residents “heavy” — which is very tolerable.
- We treat the Anaheim Island (separating Districts 1 and 2 at the bottom) as a true and obvious border. The question is: do you think that the peninsula in red should be divided with some portion of it crossing around the Island into what is now the lower part of the blue territory. The cost of that is generally that the far western parts of District 1 would need to be connected to some of the top portions of District 2 — probably even crossing the freeway — which doesn’t make sense to me if the idea is to group residents with other residents who are most similarly situated to them.
- District 3 (green) includes the entire Colony along with the other pre-war areas to its north and west. That rectangular block in the bottom right is included just because that’s the shape of the Census Block Group containing the intersection of South and East streets. That little knob sticking out to its right is there because Diana Street goes between two Census Block Groups. (That fix comes directly from Levitt.)
- District 4 (purple) contains all of South Anaheim and the Resort District. The line between 3 and 4 is dictated mostly by geography and the shape of the Census Block Groups that we use as building blocks, though I’ll be proposing moving about 280 residents from 3 down to 4 to achieve better balance. Shouldn’t be too hard.
- District 5 (still orange) contains some diverse areas, but as they aren’t big enough to constitute their own districts they have to be put somewhere — and District 5 really can’t move east into District 6’s territory. So: most of Anaheim Canyon gets combined with the area around State College and the areas just east of the Colony.
This map creates one strongly Latino majority district (18% CVAP advantage), one moderately strong plurality district (12% CVAP advantage), and one fair-to-moderate plurality district (6% CVAP advantage). Some may argue that an 18% or 12% CVAP advantage aren’t big enough for Latinos to compete; for reasons expressed below, I think that any lack would be more due to successful political gamesmanship than to any deficiency in the district composition.
Because this discussion introduces many of the ways in which the various maps differ, I’ll be referring back to it a lot.
(c) Dresser

This is the other map, besides Bengochea’s, that provides a change to District 6. Let’s put that side for now. District 5 (orange) is similar to (but less balanced than) Chuchua’s District 1. District 4 (purple) is also similar to, but less balanced than, Chuchua’s District 2 — and also stretches across Euclid. District 3 (green) combines most of South Anaheim with lots of north Central; I’d want to be convinced about that “community of interest.” District 4 (blue) seems reasonably drawn. District 5 (red), though — whoa! Not only is this imbalanced, but it joins together areas from west of Brookhurst (!) to east of Tustin. The danger here is that it seems like a way to get someone from Anaheim Hills into a district that they could possibly win. (I don’t know who lives in the District 5 area of Anaheim Hills — but perhaps the mapmaker does.) This is what the Chuchua map tries to avoid by valuing “obvious” breaks between districts.
Here are the stats, so that we can assess its balance:
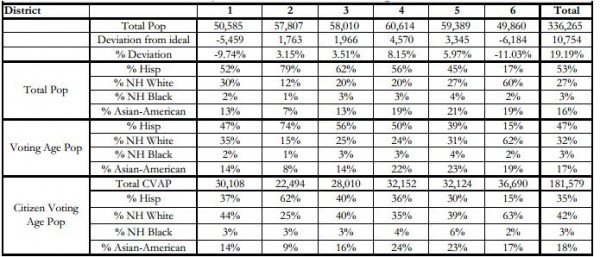
As you can see, District 6 in eastern Anaheim Hills is “light” by over 11% and its adjacent District 1 (largely corresponding to Chuchua’s District 5) is light by almost 10%. This map also packs District 2 with an extraordinary CVAP of 62% Latino voters — a margin of 37% over white voters. District 4 has a 1% CVAP advantage for Latinos over White voters — but with Latinos only at 36% (!); District 3 has them even at 40%.
If you want one — and only one — Latino on the City Council, then this is your map. Expect a lawsuit from MALDEF and the ACLU if the Council goes in this direction — especially given the (frankly inexcusable) 19% deviation of the two most discrepant districts, which looks far worse if you consider all six of them.
(d) Gallegos

This is the first map we’ve seen that winds District 2 (blue) around the Anaheim Island — and then also brings it down below Katella all the way to Brookhurst. District 1 also include most of the West Anaheim peninsula with a whole lot of acreage north of Crescent St. all the way to Euclid. I’m not sure of the logic behind it — unless my friend Claudio Gallegos is trying to please Lucille Kring with District 2, who I’m lives in that block east of Euclid and around Orangewood and I’m told badly wants her district to extend to and beyond Anaheim Island to the west — but he will presumably explain it tonight. Let’s see if the stats can shed any light on it.

OK, that clears things up nicely. While Gallegos’s aims might be partisan here — I presume that he’s likely to have considered the partisan composition of the districts — his main aim seems to be based on promoting Latino candidates, which I consider a perfectly worthy goal. This is the opposite, in some ways, of the Dresser map above: Gallegos creates two districts where Latinos have more than half of the voter registration, meaning that it should be pretty likely that a Latino candidate can win them. (For those of you who want it simple: Dresser = “one Latino District” and Gallegos = “two Latino Districts.” That’s what the partisans are likely to be fighting about here.)
I’m not at all unsympathetic to what Gallegos wants to do here — increasing the political power of Latinos in a city that is majority Latino. My problem with it is that it won’t work. This trick — which Democratic Party officials love to use because it seems like it should work — is too easily beaten. I can explain why in two words: “Jenny Rivera.”
Jenny Rivera — not the late lamented singer, but her namesake — was a political unknown who was induced to run in Anaheim to, in part, take advantage of her sharing a name with that popular musician. She was in little danger of actually winning a seat; her role was simply to absorb a good number of Latino votes that would otherwise go to another Latino candidate, most likely John Leos. And the countermeasure worked. And it may well work again.
If you have, say, Lucille Kring running for reelection in November 2016 in a majority Latino district, with one strong Latino challenger, one can imagine that a second Latino challenger will crop up — probably with decent funding (at least through independent expenditures) from Kring’s political allies — to divide the Latino vote. Meanwhile, dividing the White vote would be a much tougher stunt, because Kring is the incumbent and so people are less likely to vote merely along racial lines. Yes, ethnicity provides lower-information ethnic voters a cue for how they should vote — but that cue is easily obscured by dirty tricks.
This same “dirty trick” occurred last year when Joe Moreno — now calling himself “Jose ‘Joe’ Moreno” — ran against Dr. Jose F. Moreno. First, expecting that Dr. Moreno would run for reelection to the Anaheim City School Board, “Joe” filed for that race. When Moreno then switched to City Council, “Joe” quickly did the same — dropping the nickname by which he is generally known to run simply as “Jose Moreno.” (Any argument that he was not running simply to hobble Dr. Moreno’s chances should, at that point, be rejected out of hand.)
A small advantage in voter turnout is nice, is good, is to some extent required by law — but it can’t beat gamesmanship. And so the question is whether it is worth having some ugly and non-intuitive district boundaries and a higher deviation from balance just to set up a plan that can be so easily defeated with gall and guile. Maube, but I have my doubts.
(e) Henninger

The main differences between Henninger’s map and Chuchua’s are that (1) he uses I-5 rather than Euclid Ave. as the dividing line between the Districts 2 and 3 and (2) he divides lengthwise the historic “Anaheim Colony” — which to my mind is almost a textbook example of a “Community of interest.” He does not cross the Island, and his norther border of District 4 seem fairly intuitive. But the Colony thing bothers me. Let’s check out the stats.
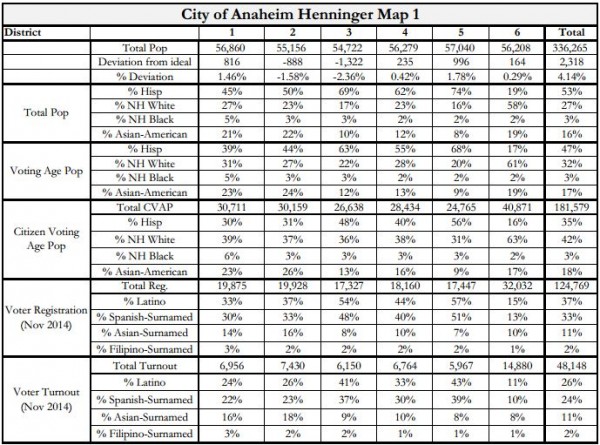
The first thing that strikes me is that the deviation is higher than I’d prefer. This creates on Latino majority district (#5) and one (#3) with a healthy CVAP plurality of 48%. A third district (#4) has a 2% CVAP plurality of 40% — which likely translates into a minority when voter registration is taken into account. This is similar to what I came up with when I wanted to draw the line down I-5 — which from what I can tell is not such a big deal to residents and the main streets all pass over it — and it just seems inferior to using Euclid Ave. But slicing up the Colony — the only residential community of interest besides Anaheim Hills and Anna Drive with which many Anaheim speakers seem to loudly and frequently publicly identify — like this is my major complaint with this one.
(f) Kim

Kim’s map is similar to, but less extreme than the one submitted by Gallegos. It also extends around the Anaheim Island, but it retains I-5 as the border between District 2 and the northern district (here District 4) and stops the southwestern border of District 2 further west, at Ninth Street. The result is that District 5 is even more distended (and even less likely to represent anything close to a unifying “community of interest”) than in the Gallegos map. On the positive side, is can use Ball as a southern border for the entirety of District 3.

Looking at the stats, it has better total balance than the Gallegos map. It is more extreme, however, in the sense that while it creates two very strong Latino districts — District 3, with CVAP of 54% Latino to 32% White and District 4, with CVAP of 52% Latino to 32% White — all four of the other districts have White CVAP pluralities, the lowest of these being a 41% to 38% margin. If one wants a map with two overwhelming Latino-CVAP majorities, these seem pretty comparable.
(g) Lugo
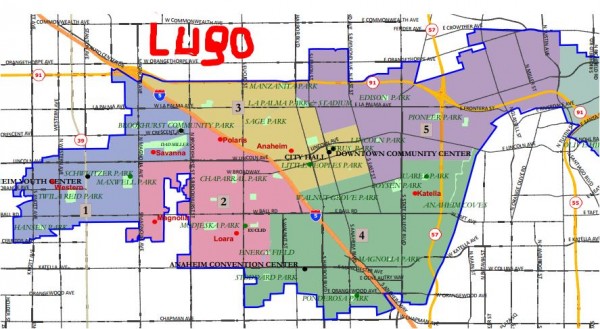
Lugo’s map, again, did not go through the same processing as the others, which is why it looks different. It shares some characteristics with Henninger’s map: straddling the Anaheim Island and using I-5 as a boundary right down to South Street. It looks like it divides the Colony district at Sycamore, however, which is perplexing and undesirable.

Lugo’s map reduces the Deviation score of Henninger’s map by about 1/3. It creates one strong Latino district (#5) with a 54% to 33% margin in CVAP, a moderately strong plurality district (#3) with 47% to 36%, and a moderate plurality district (#4) with a 43% to 36% margin in CVAP. In those respects, it is pretty clearly superior to Henninger’s, but shares the same deficiency (although with different lines) regarding the Colony.
(h) LULAC 1

This is another entry in the “create two extremely strong Latino districts at the expense of Latinos having a strong presence in the other four districts” category. Its lines are even more extreme than those of Gallegos or Kim, with District 1 stretching from the west to Euclid north of La Palma and District 4 stretching from Lincoln and the river to Euclid (north of Broadway and south of Cerritos, but not in between.) It also dramatically divides the colony.
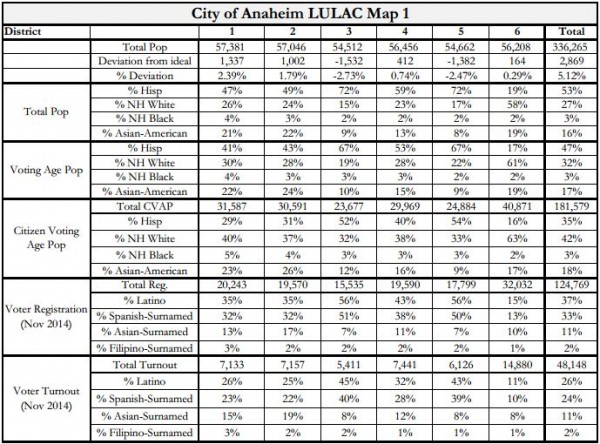
Its Deviation score is a relatively high 5.12%. Its Districts 3 and 5 are both majority Latino with margins of 20% and 21%, respectively, in CVAP. District 4, despite a slight Latino majority, would be unlikely to be competitive. The degree to which it is obviously gerrymandered leaves little reason to prefer it to the Gallegos or Kim maps, which serve the same end with greater cohesiveness and compactness of districts (with the exception of the problems with Gallegos District 2.)
(i) LULAC 2

This district combines the deficiencies of several districts already noted above. (This includes the straddling of the Anaheim Island; the extreme stretching out of Districts 1, 2, and 3; an implausible carving up of the Colony; and a feature new to this map: a substantial watering down of the power of Anaheim Hills by making it quite heavy.) The degree of gerrymandering is not likely to inspire public confidence in the fairness of the lines on the part of the electorate.
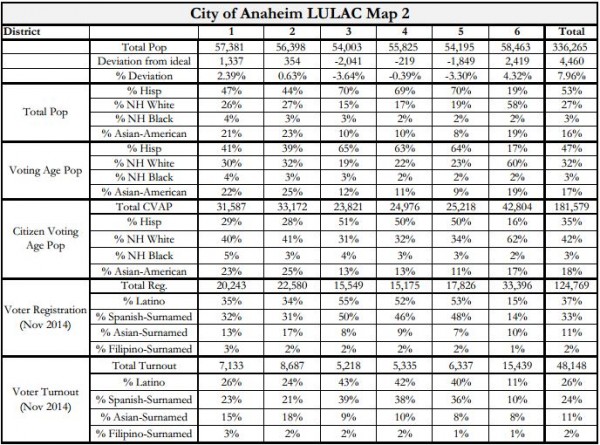
Notably, the two most white districts by CVAP (District 6, then District 1) are made the heaviest, while the two most Latino districts (Districts 3 and 5) are made the lightest. This is not quite so extreme as to be the equivalent of the Bengochea map, but the “errors” in deviations are in the exact opposite pattern as are those in the Dresser map — although the Dresser map is in this respect more brazen and extreme (and probably illegal.) This is another very good example of why the Chuchua map strives to have districts be as close to equal population as possible — to make the map overtly fair-handed.
(j) Mills

If the goal is to create the greatest number of districts where Latinos will have an advantage in CVAP, and if obvious gerrymandering to serve that end is not considered to be a problem, then this is the best map from the perspective of promoting Latino electoral success. Its costs in terms of obvious gerrymandering are evidence on its face; this either bothers one or it doesn’t. The Mills map does keep the Colony together and does not encroach into District 6.
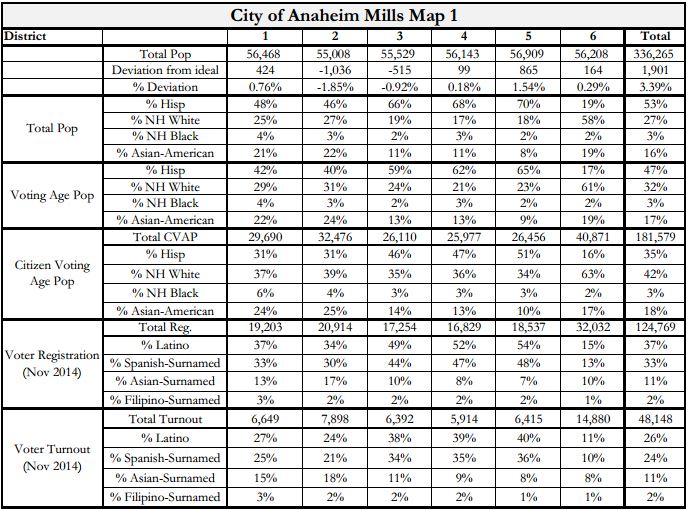
The Mills map has an overall Deviation score of 3.39% — about in the middle of this pack. It creates three Latino majority districts. One, District 5, is majority Latino with a CVAP of 17%. (This is lower, it bears note, then the 18% of the best Chuchua district, which we argue is not gerrymandered at all.) The other two districts, #4 and #3, are close to being Latino majority. Their respective CVAPs are 47% and 46%, each of which has an 11% margin over White voters. (Each is thus slightly inferior, from the perspective of promoting Latino electoral prospects, from the Chuchua map, the second most Latino district of which is 48% CVAP with a 12% margin over White voters.) Each is a bit superior, though, to the third most Latino district in the Chuchua map, which has a 42% Latino CVAP and a margin of 6% above that district’s White voters.)
In choosing among districts, “gerrymandering” enters the calculus in at least two ways: in the consideration of “compactness” (which is discretionary and need not receive high weight) and in communities of interest. The test with this map is — do these districts really represent communities of interest. Comparing it to the Chuchua map, how readily could a resident of a district say that they live in “X” District, which is located in “geographical indication” of Anaheim. For the Chuchua map, our districts could be called “Far West,” “Near West,” “North-Central,” “South-Southeast,” “East-Central to Northeast (to Canyon)” and “Anaheim Hills.” We are not sure what terms we would apply to the Mills map. But, we also not know whether that will matter to people.
(k) Warner

If one must, for whatever reason, choose a map that winds around the Anaheim Island and puts far western Anaheim in the same district as the Brookhurst exist off of I-5, we like this one best. It retains Euclid as a border, keeps the Colony together (though not some of the areas just to its north, south of La Palma, that seem to fit with it, has a clear border between Districts 3 and 4, and District 5 is not too massively long.

It creates one clear Latino majority district (#5) with 54% CVAP and a margin of 21%; one Latino almost-majority district (#4) with a 49% CVAP and a 15% majority; and one district (#3) in which, while technically Latino plurality at 39% to 38%, it will be hard for Latinos to compete. That’s pretty fair, although we prefer the Chuchua formulation. But we wouldn’t feel too badly to see this map be chosen, with the exception that we think it does a poorer job than ours of combining Little Arabia into one district.
And, with that, see (some of) you tonight at 6:30!
Brian’s map is clearly the best. As usual LULAC can be counted on for gerrymandering.
P.S. Except for the numbers count, the “consultant’s” 3 efforts are really almost completely arbitrary. Quite ridiculous.
OK I am confused, which 3 are by a “consultant” Mr. Zenger? I missed this. I thought these supposed to be Anaheim residents? Other than the LULAC guys who are Santa Ana residents. Don’t get me started. Zeke is a good guy (mostly) he works his butt off for the OC Veteran’s cemetery project down at Great park. Art Montez owes the world backpay for the oxygen he uses. yeah I said that out loud, without regret of any kind. Why Zeke hangs with him is a mystery to me. But there you have it. David, what consultant maps did I miss?
The consultant maps are on the City’s website. Embarrassing.
Of course I am trying to figure out if PringleCorp will be submitting a map and who might be doing it.
P.S. Zeke and Art made fools of themselves during the County’s redistricting with their LULAC map – all cut up in ridiculous ways to create a Latino district. I wish these guys would just get out the vote in a General Election instead of whining about under-representation.
Yeah I admit to not watching the process very closely (although it did not occur to me anyone would be so stupid as to split the Colony) but as the one red dot in a sea of blue map, I know that no matter HOW my area gets carved up it is up to me and a handful of conservative neighbors to get out butts out there and work the neighborhoods and precinct maps. So while where the boundary line ends does matter, to me it matters to the extent of where I stop walking a district and cross the street to work the other direction back again. Any whining about “under representation” is counter productive at this point, the city is being carved into those more manageable portions,and we should all have the equal chance to get out there and campaign. We get equal opportunity, but no guarantee of equal outcome.
Map’s drawn. All youse got to do is climb on board!
Please don’t use the word “carve.” That’s the Kleptocracy’s phrase suggesting Balkanization and impending doom.
Anaheim is being refined.
The plan submitted by Oscar Reyes actually is the best of the bunch so far.
See, this is a problem with anonymous posts. I don’t know if you are THE “Anaheimster” or someone ripping off Todd Priest’s — or, um, *whoever’s* —screen name.
Because Reyes didn’t provide a full map of the city and the demographer apparently hadn’t gotten around to creating a web view for it, I didn’t have time yesterday to critique it. I hope to get to it at the same time as I get to the demographer’s three submissions.
What aspects of it do you like so much?
As far as the maps dividing the Colony and/or dividing the Colony and its satellite Historic Districts, I am not sure why they are included because they don’t seem legal. I agree with Greg and Brian (surprise!) although I was not involved in the maps, it is obvious that the City’s 4 historic districts are indeed a “Community of Interest” according to the Cal Constitution. Our economic interests are shared by real estate values which depend almost entirely on status as contributors to one of 4 Historic Districts, because they relate to each other as a whole. When taken out of their context as contributors they lose much of their significance, and thus lose their value. Of the 4 Historic Districts in Anaheim, I was involved in creation of 3 of them, and we did indeed agonize over where to draw the lines in order to include cohesive and contiguous designations, which can negatively affect the financial stability of those living in the areas if someone goes messing with artificial lines. While Council Districts may not change the boundaries of our historic districts, how is the City to run preservation programs if more than one Council member is responsible for the staff implementing the programs? Our Mills Act process is already a train wreck waiting for a lawsuit, we really don’t need two leaders bickering over the process in addition to the problems that have been creeping into the system. Sorry but any map that divides the obvious COMMUNITY OF INTEREST represented in the so-far contiguous Historic Districts needs to be tossed out.
The California Constitution defines a community of interest as:
A community of interest is a contiguous population which shares common social and economic interests that should be included within a single district for purposes of its effective and fair representation. Examples of such shared interests are those common to an urban area, a rural area, an industrial area, or an agricultural area, and those common to areas in which the people share similar living standards, use the same transportation facilities, have similar work opportunities, or have access to the same media of communication relevant to the election process. Communities of interest shall not include relationships with political parties, Incumbents, or political candidates.
-Section 2(d)(4) of Article XXI of the California Constitution
*From the outside…..actually looks like you have a few good choices there. Now comes the most important part of the process. You need to poll the current City Council and ask which version they endorse. Then pick the top three and put those before the voters for approval.
You’re joking right? The council was against this. And how could they be objective in any case?
I’m not actually sure how the approval works, but at some point, the Council is going to have to approve the final lines.
Okay… I shoulda read the story first.
“Please don’t use the word “carve.” ….”
DZ getting PC ? SAY it AIN’T so !!
Part of the “refining” process (separation into parts) is called “cracking” (Any help here Ryan?) So maybe we should say Anaheim is being CRACKED ! Now all we have to do is determine how to safely handle the toxic slippery by-products !
Well, “carve” is so pejorative. You carve up a roast or a turkey. Then everybody grabs his slice and gobbles it up.
That uncooked, indigestible ooze you might slip on if it hits the floor will be the way the crooks try to protect Brandman and Eastman. And maybe keep Kling out of a district with a strong Latino type dude (or dudette, if there is one).
P.S. Eds., “Kling” is not a typo.
We know, David.
Damn smell-check, eh?
isn’t the dividing of the city into districts, or quadrants, just a continuation of the balkinazation of our society. wasn’t it better when we all voted as one
Who cares? Balkinization is a great blog! If you like legal analysis, check it out!
thanks for the tip
and remember last week when i asked about the pandemic of action to sanitize our history by removing every reference to the confederate flag and you postulated that it wasn’t that out of control, well tvland, that great arbitrator of taste and culture, has just removed the dukes of hazard from their rotation because the car has a confederate flag on the roof. i think that we have gone too far
You’re right. The Dukes of Hazzard should instead be removed because Daisy Duke is not wearing a veil.
*The General Lee was a fine car that was used and abused by Red Necks with little regard for wheel wells filled with mud and dirt. Barbara Bach had the best hot pants that were ever displayed, with the exception of some special Charlie’s Angels Episodes with Jaclyn Smith or Tanya…….or Farah or …… Well, let’s just say as long as they don’t take off Lost in Space or Get Smart…….the world will still be safe for Democracy. Gilligan’s Island and Marianne was actually our personal favorite. So remember, the reason for the Confederate Flag on the roof of the General Lee was so fans could recognize that it was a Mopar product as opposed to a GM or Ford.
Barbara Bach
*Wrong Bach. Johann Sebastian…maybe? Love those orchestral Suites…Wow!