.
.
Anaheim was forced to impose election districts because Latino voters and candidates were getting excluded from power under the previous system. So, of the 25 maps we have to examine (not counting the quarter map), it is natural to ask how many Latino plurality districts each of them created — and with what characteristics? We’ll review various characteristics of the maps this week, but this seems like a good place to begin.
Our first table looks at how likely it is that Latino candidates would be elected under each map. To do this we have to make some simplifying — I’d say simplistic — assumptions. If (1) there were only one Latino and one non-Latino candidate in each district, and (2) they were alike in every way other than ethnicity, and (3) everyone who could vote did come out and vote solely on that basis of ethnicity, what would happen?
First, we’d be surprised. In real life, we may sometimes approach to this sort of situation, but most often we don’t. Each above assumption would often fail in practice. But this may be the best way we have to evaluate these districts: presuming that Latino ethnicity was an overriding concern for voters.
You’ll probably notice that you get a very different sense of the submitted maps when you look at a table summarizing them than you do when looking at the actual graphics representations themselves. Some maps that looked quite good to me didn’t look so good when I ran them through the wringer.
Here’s the table we’ll be discussing today:
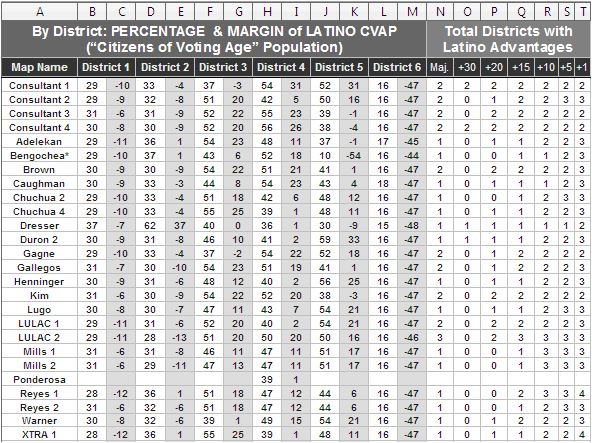
To the left, you have the names of those submitting maps, as reviewed here. You’ll then see a pair of numbers for each district created by each map. The unshaded column shows the proportion of each district’s “CVAP” — it stands for “Citizens of Voting Age Population,” or in other words the potential pool of voters — that is Latino. (Federal law suggests that in a situation like Anaheim’s, at least one “majority-minority” district must be created: in other words, one district must have more than 50% Latino CVAP.)
The shaded column for each of the six districts shows the margin by which Latinos exceed the next most populous ethnic group (which in all cases would be whites) or trail the most populous ethnic group in these CVAP numbers. (In either case, for present-day Anaheim, the group that Latinos lead or train would be non-Latino whites.) Obviously, if all else is equal, Latinos having a larger lead in a given district means that they will be more likely to be able to elect a Latino if they choose.
The columns to the right give a quick-and-dirty estimate of how many districts would be competitive for Latino candidates. It first lists the number of districts where Latinos must be a 50% majority. (Again, there must be at least one.) Then it lists the number of each map’s distracts where the margin by which the percentage of Latino voters exceeds the percentage of White voters by given levels: 30, 20, 15, 10, 5, and 1%.
White voters tend to turn out at a higher level than Latinos, so in real life — that is, without those assumptions we made — we’d expect that the Latino CVAP for a given district would have to exceed the White CVAP by some margin. We’re not sure what it is — 4%? 6%? 8%? — and of course it would likely change across different circumstances. But at some point we have enough of a Latino plurality that (at least if the Latino vote isn’t split — which is a historical questionable assumption in Anaheim) the district would be “safe” if everyone voted by ethnic lines (with non-White non-Latino voters splitting equally. And there’s another unsafe assumption!)
If you look over at the right-most column, Column T, you’ll see the total number of plurality Latino Districts created by each map. Most create 3 of them. Some create 4, although in most cases the last one or two will be very narrow margins. Some — including two by the Demographer — create only 2. Creating only 2 Latino plurality districts — even if they’re very Latino — makes it very likely that at least a majority of the next Council will be non-Latino. In other words, is sort of locks in a “minority status.”
[More coming up later today; first, there’s a funeral for much of OJB to attend!]
Where is Part 3?
I have been hella busy and this requires research and analysis, not just commentary. I hope to have one up tonight, one or two more up tomorrow. Wednesday isn’t the last of their meetings, but it is an important one.